 pepe
pepeComparing two runs

pepe compare holds a report against an earlier one of the same test and says what moved, in the verdict's words. A number is only called a change when it moved more than two runs like these wobble on their own: the run's own latency spread, scaled by how many requests back the number, so a p99 from 200 requests is given more room than one from 20,000.
pepe --json -n 5000 -c 20 https://staging.example.com/api > before.json
# ... deploy ...
pepe --json -n 5000 -c 20 https://staging.example.com/api > after.json
pepe compare before.json after.jsonpepe · compare before.json → after.json
▲ Slower · 5,000 → 5,000 requests · p99 120.0ms → 166.0ms · 260 req/s → 252 req/s
▲ p99 up 38%: 120.0ms → 166.0ms
✔ Median within the usual spread: 30.00ms → 31.00ms (±5%)
✔ Throughput within the usual spread: 260 req/s → 252 req/s (±5%)
▲ A long tail is new: p99 is 5.4× the median, was 4.0×The verdict
One of Faster, About the same, Slower, and, when failures appeared or rose, Worse (or Better when they fell): failures outrank speed. What is compared: the p99, the median, the throughput (which, at fixed concurrency, follows the median and wobbles as much), the failure share, and the shape of the latency: a long tail that appeared or went is said. Two reports of different targets or concurrency are compared all the same, with that said first.
What can be compared
| Reports | Compared on |
|---|---|
Two runs (pepe --json, --snapshot, API mode, a flow, a replay) | p99, median, throughput, failures, the tail |
Two ramps (pepe ramp --json) | The capacity estimate and the level that held, with failures |
Two pings (pepe ping --json, --save) | p99, median, pings lost, and the median of each phase: DNS, connect, TLS (full and resumed), first byte, download; the interval is checked too |
A ping report has no latency spread, so its jitter stands in for it. For a ping, a slower connect or a slower handshake is told from a slower server:
pepe · compare before.json → after.json
▲ Slower · 600 → 600 pings · p99 50.00ms → 72.00ms
  ▲ Median up 50%: 40.00ms → 60.00ms
  ▲ Connect up 150%: 10.00ms → 25.00ms
  ▲ TLS handshake up 60%: 25.00ms → 40.00ms
  ✔ First byte within the usual spread: 6.00ms → 6.00ms (±5%)
Flags
| Flag | What it does |
|---|---|
--gate | Exit 1 when the verdict is Slower or Worse, for CI |
--json | The verdict, each number before and after with its change and the spread it was held against, the findings, and the verdict as a badge's three parts |
--svg <FILE> | Draw the verdict as a card, the way the dashboard draws, for a README, a site or a report |
The badge is pepe | slower · p99 +38%, in a colour, as shields.io and the like draw one. pepe schema compare prints the JSON's schema.
The card
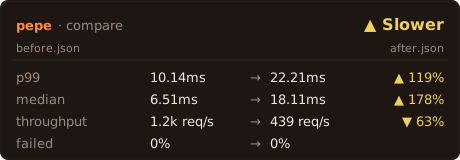
Self-contained SVG in pepe's palette: the word in its colour, then p99, median, throughput, capacity and failures before and after, each with what moved or the spread it stayed within.
In CI
The GitHub Action keeps each branch's last report and holds a pull request against its base branch with pepe compare, posting the result as a comment and failing the step on a regression when asked.